Recently, the team at Draper & Dash have been working with a number of trusts to improve their data quality and to provide external assurance that their processes are fit for purpose. This has been an exciting challenge and it has fun to get to work with various sets of data.
We have structured a very interesting programme and have created tools that effectively risk score certain data items – these work by analysing the various stages of the data process and looking at each one of the areas to effectively identify, track and rectify issues:
The data assurance triangle approach (DATA)
Our programme works with trusts to effectively tackle specific areas of the DATA framework to aid all areas of data improvement, confidence and assurance:

This type of model falls into the creative solutions sub triangle and the approach we have used allows the capturing of indicator outliers across a multidimensional data set.
What problem does this approach solve?
When trying to detect anomalies normally an analyst undertakes time consuming analysis to effectively identify metrics or points that deviate massively (outliers) from the normal excepted range.
The benefits of this approach are that this model can look across thousands of indicators / metrics and identify those that deviate outside the normal range aka outliers and it can reduce the manual intervention and analysis that an analyst has to conduct to find these anomalies. Therefore, saving time to get on with analysing other key business areas.
What is the model and how does the model solve this problem (warning a little theory!)
The model we have chosen to discuss in this post is the isolation forest this is very similar to random forest used normally for non-linear classification / regression.
The main idea, which is different from other popular outlier detection methods, is that Isolation Forests explicitly identify anomalies instead of profiling normal data points. Isolation Forest, like any tree ensemble method, is based on decision trees. The tree partitions are created by first randomly selecting a feature (indicator or metric) and then selecting a random split value between the minimum and maximum value of the selected feature.
The forests then are able to detect, using similar partitioning methods to random forests, the normally distributed observations and the outlier (abnormal) observations. The added twist, is that these models can accurately detect outliers across lots of columns (features).
From all these clever statistics, an anomaly score is created, the mathematical formula is not listed here for clarity and not to make this too theoretical. What essentially the model does is creates a score between 0 to 1, these scores can be interpreted as below:
A score close to a 1 indicates an anomaly
Scores much smaller than 0.5 indicates normal observations
If scores are close to 0.5 then the entire sample does not seem to have clearly distinct anomalies
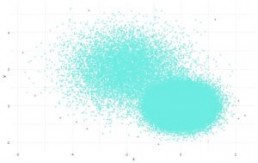
This was created using an R package and shows the normally labelled points (light blue) and the outliers (pink). However, another way to use this would to be to produce a flat file to be consumed by any BI solution.
How can this be used?
This can be used as below:
- Comparison of metrics across a number of dimensions. This could be RTT incomplete, admitted, non-admitted. This would use this dataset and detect where outliers exist across all these indicators together
- Linkedin use this method for detecting and preventing abusive accounts
- Across two or a number of different data quality markers – this is the application of this model currently relating to the data assurance programme.
What else are we developing?
On the back of this work – we are currently developing a method to anomaly detection on time series models. This is something that is in the pipeline and we will update you at a later stage regarding this model.